Signup for our newsletter to get notified about sales and new products. Add any text here or remove it.
No products in the basket.
Return to shop
$5.00
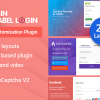
Digits : WordPress Mobile Phone Number OTP Signup and Login Form
PDF Tools for Real3D FlipBook
WPBookit Google Calendar Advanced Sync (Addon)
Bookshelf for Real3D Flipbook Addon
Bookly Outlook Calendar (Add-on)
Smart NFT 1155 Multi-token standard addon
Smart NFT Bulk minting (Addons)
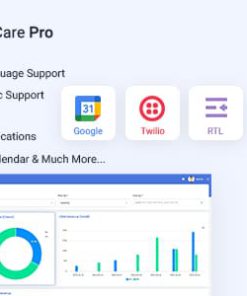
Kivicare Pro Clinic & Patient Management System EHR (Add-on)
Username or email address *Required
Password *Required
Remember me Log in
Lost your password?
Email address *Required
Your personal data will be used to support your experience throughout this website, to manage access to your account, and for other purposes described in our privacy policy.
Register